
Most founders know the feeling. The charts are open, the demo requests are coming in, and the dashboard says churn moved up, but nobody can say whether the cause was pricing, onboarding, or failed payments. That gap between seeing a number and knowing what to do next is where customer analytics starts to matter.
A lot of SaaS teams think analytics is the scoreboard. In practice, it's the system that helps you decide whether to fix onboarding, rework a plan, repair a dunning flow, or investigate a support issue before it spreads. That's why the category has become so large, one market study estimates the customer analytics market at USD 17.58 billion in 2026, up from USD 14.82 billion in 2025, with a projected rise to USD 41.28 billion by 2031 at an 18.62% CAGR (Mordor Intelligence market study).
Table of Contents
- When Dashboards Stop Answering Your Questions
- What Customer Analytics Means for SaaS
- The Core SaaS Metrics That Drive Real Decisions
- Segmentation That Reveals What Averages Hide
- Choosing the Right Customer Analytics Tool Stack
- Instrumenting Events and Building a Trusted Data Layer
- Turning Analytics Into Retention and Monetization Decisions
- A Practical Starting Point and What to Skip
When Dashboards Stop Answering Your Questions
The founder has the chart open. Churn ticked up, trial conversions dipped, and the support inbox was busier than usual. The dashboard can show what changed, but it cannot explain whether the cause was a pricing update, a broken onboarding step, or a payment failure inside the billing system.
That is the point where customer analytics shifts from reporting to decision-making. A dashboard can show a line going down, but a real analytics program ties that line to the product events, subscription events, and support signals that produced it. Without that connection, teams keep arguing from instinct instead of fixing the actual issue.
A useful way to think about this is simple. If the dashboard is the gauge cluster in a car, customer analytics is the diagnostic system that explains why the warning light came on. The data has to connect behavior, money, and support if you want a believable answer.
The category has grown around that need. Teams are clearly choosing cloud-delivered reporting and analytics tools, and that pattern shows how central shared visibility has become in SaaS stacks. The reason is practical, because product, finance, and support teams need the same evidence before they change onboarding, pricing, or dunning.
Practical rule: if a chart cannot help you decide whether to change onboarding, pricing, or dunning, it is reporting, not customer analytics.
What Customer Analytics Means for SaaS
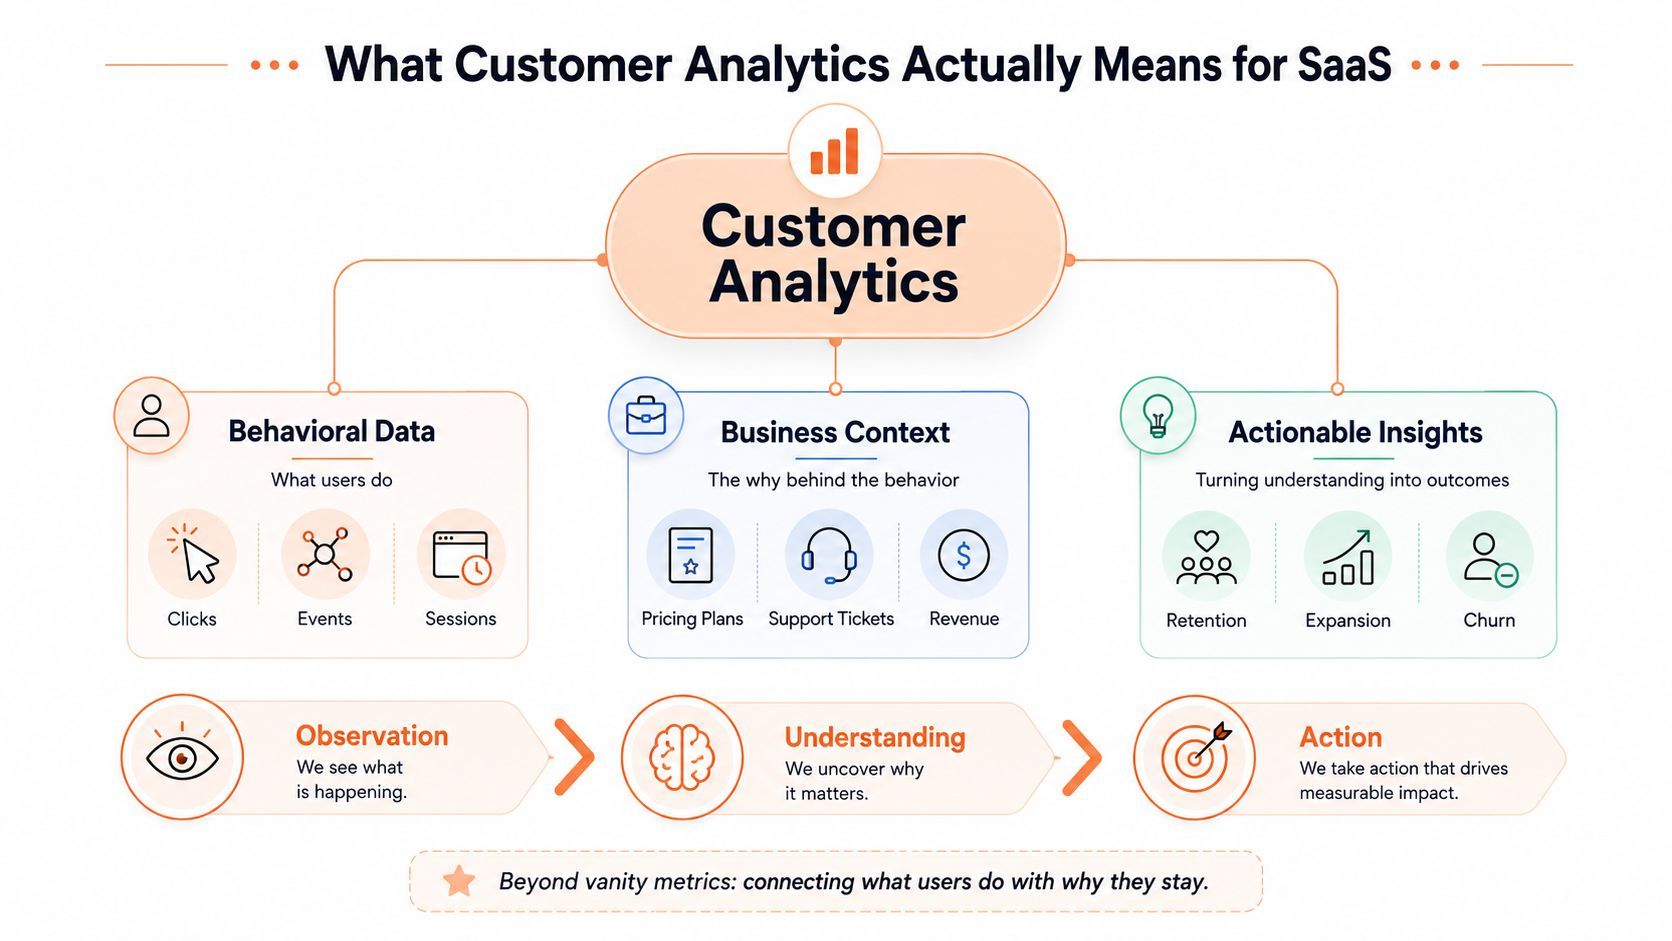
A founder opens the product dashboard and sees healthy signups, but renewals are slipping and support keeps hearing billing complaints. Customer analytics is the discipline that connects those signals so the team can decide whether the issue sits in onboarding, pricing, dunning, or the product itself. That requires behavioral events, transactional data, support interactions, and feedback signals to live in the same view, so the team can trace cause to effect instead of describing activity in isolation (Quantum Metric guidance).
Three data types that need to sit together
Behavioral data shows where people clicked, where they stalled, and where they gave up. Transactional data shows what they bought, renewed, refunded, or failed to pay. Support and feedback data show what customers said, what they complained about, and whether the experience felt easy or painful.
Keep those layers apart, and each team sees only part of the story. Product may point to strong usage, while finance sees more failed renewals and support hears billing complaints. Put those signals together, and the pattern becomes clearer for the people making decisions about retention and revenue.
If you only track actions, you know what happened. If you also track support and revenue outcomes, you can start to infer why it happened.
Descriptive, behavioral, and predictive in plain SaaS language
Descriptive analytics answers what happened last week. Behavioral analytics shows how people moved through the product. Predictive analytics estimates what is likely next, such as which accounts may churn or which users are ready to expand.
Each layer supports a different SaaS decision. Descriptive reporting might show trial signups rose. Behavioral analysis points to the step where those signups stalled. Predictive work helps a team decide which accounts need attention first, especially before a pricing change, an onboarding revision, or a dunning flow adjustment.
This is also where unified first-party data matters. SaaS teams cannot rely forever on incomplete platform signals or attribution that misses the payment side of the business. They need their own data layer, built from product events, billing records, subscription history, and support context, so the company can trust its view of the customer and calculate outcomes such as recurring revenue with more confidence, including methods covered in this ARR calculation guide for subscription businesses.
The Core SaaS Metrics That Drive Real Decisions
A SaaS founder can stare at a dashboard all morning and still miss the decision hiding underneath it. One screen may show traffic, another may show signups, and a third may show payments, but the question is usually tied to a concrete choice, such as whether onboarding needs a rewrite, whether a plan change is pressuring conversion, or whether billing friction is hurting renewals.
Amplitude's customer analytics guidance groups CAC, activation rate, DAU/WAU/MAU, retention rate, churn rate, CLV, and NRR as core product metrics across acquisition, activation, engagement, retention, and monetization, while support teams often standardize CSAT, CES, FCR, and AHT as operational measures (Amplitude metrics guide). That mix matters because no single metric answers every SaaS question.
Core SaaS Metrics by Lifecycle Stage
| Lifecycle stage | Metric | Business question it answers |
|---|---|---|
| Acquisition | CAC | Are we spending too much to acquire a customer? |
| Activation | Activation rate | Is onboarding getting users to value quickly? |
| Engagement | DAU/WAU/MAU | Are people returning often enough to build habit? |
| Retention | Retention rate, churn rate | Are we keeping the customers we already won? |
| Monetization | CLV, NRR | Are customers worth more over time, and are existing accounts expanding? |
These metrics become useful when they point to an action. If activation is weak, the useful question is which onboarding step needs to change. If churn rises, the next question is whether the cause sits in product usage, support, or billing.
Support metrics add another layer. CSAT shows whether the interaction felt good, CES shows whether the customer had to work too hard, FCR shows whether the issue was resolved on the first contact, and AHT shows the cost of handling it. Those measures do not replace product metrics, they explain what happens when a customer needs help.
For subscription businesses, the revenue layer also matters. A simple guide to ARR calculation for subscription businesses becomes more useful when it sits next to activation, churn, and expansion metrics, because recurring revenue only grows when product usage and billing behavior both hold up.
Business lens: every metric should answer a question a founder, product lead, or support manager can act on this week.
Segmentation That Reveals What Averages Hide
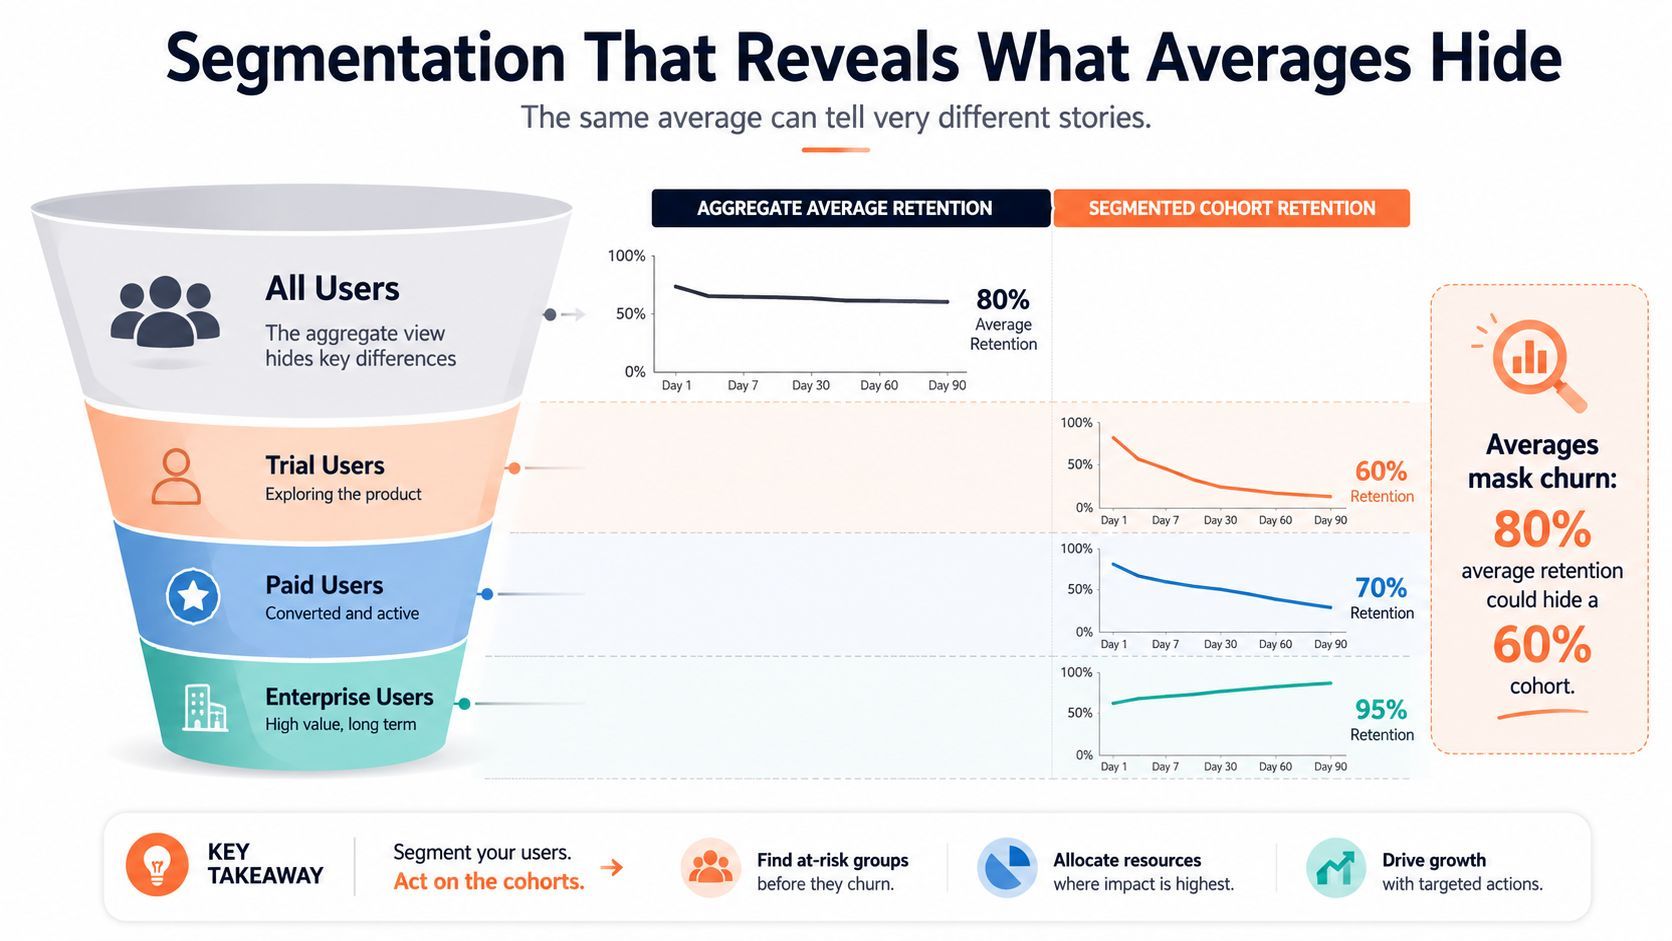
Averages can hide important variation. A retention line that looks steady may hide a trial cohort that is falling off quickly while a loyal enterprise cohort keeps the total afloat. Customer analytics becomes more useful once you compare retention curves instead of relying on one blended number.
Find the segment you're under-serving
Plan tier is a useful starting point, but it rarely explains the full story. A stronger segmentation model looks at behavior, lifecycle stage, acquisition channel, and payment outcomes. Those groups usually show where customers stall, where they renew smoothly, and where they expand.
A SaaS founder can start with one narrow question, such as improving retention for trial-to-paid users. Trace the journey from first login to renewal, then instrument the events once so the same definitions apply across product, subscription, and billing data. From there, compare retention, average order value, support contacts, and upgrade rates by segment, as outlined in Predictive Marketing guidance. That kind of view is more reliable when billing records, subscriptions, and event data are kept in the same analysis layer, as described in billing for SaaS analytics and reporting.
Read churn like an investigator
A churn spike should never be treated as a single number. Check it beside product events, support-contact rates, and payment-failure data. The same churn rate can mean very different things across cohorts. One segment may be leaving because onboarding failed, while another may be losing customers to failed renewals.
That is why validation matters. After you change onboarding, pricing, or billing logic, test the result with an A/B test or a holdout cohort instead of assuming the trend changed because of your intervention. If the average improves but the cohort you care about does not, the work is still incomplete.
Useful habit: compare curves first, averages second. Averages tell you whether the business moved. Curves show which customers moved.
Choosing the Right Customer Analytics Tool Stack
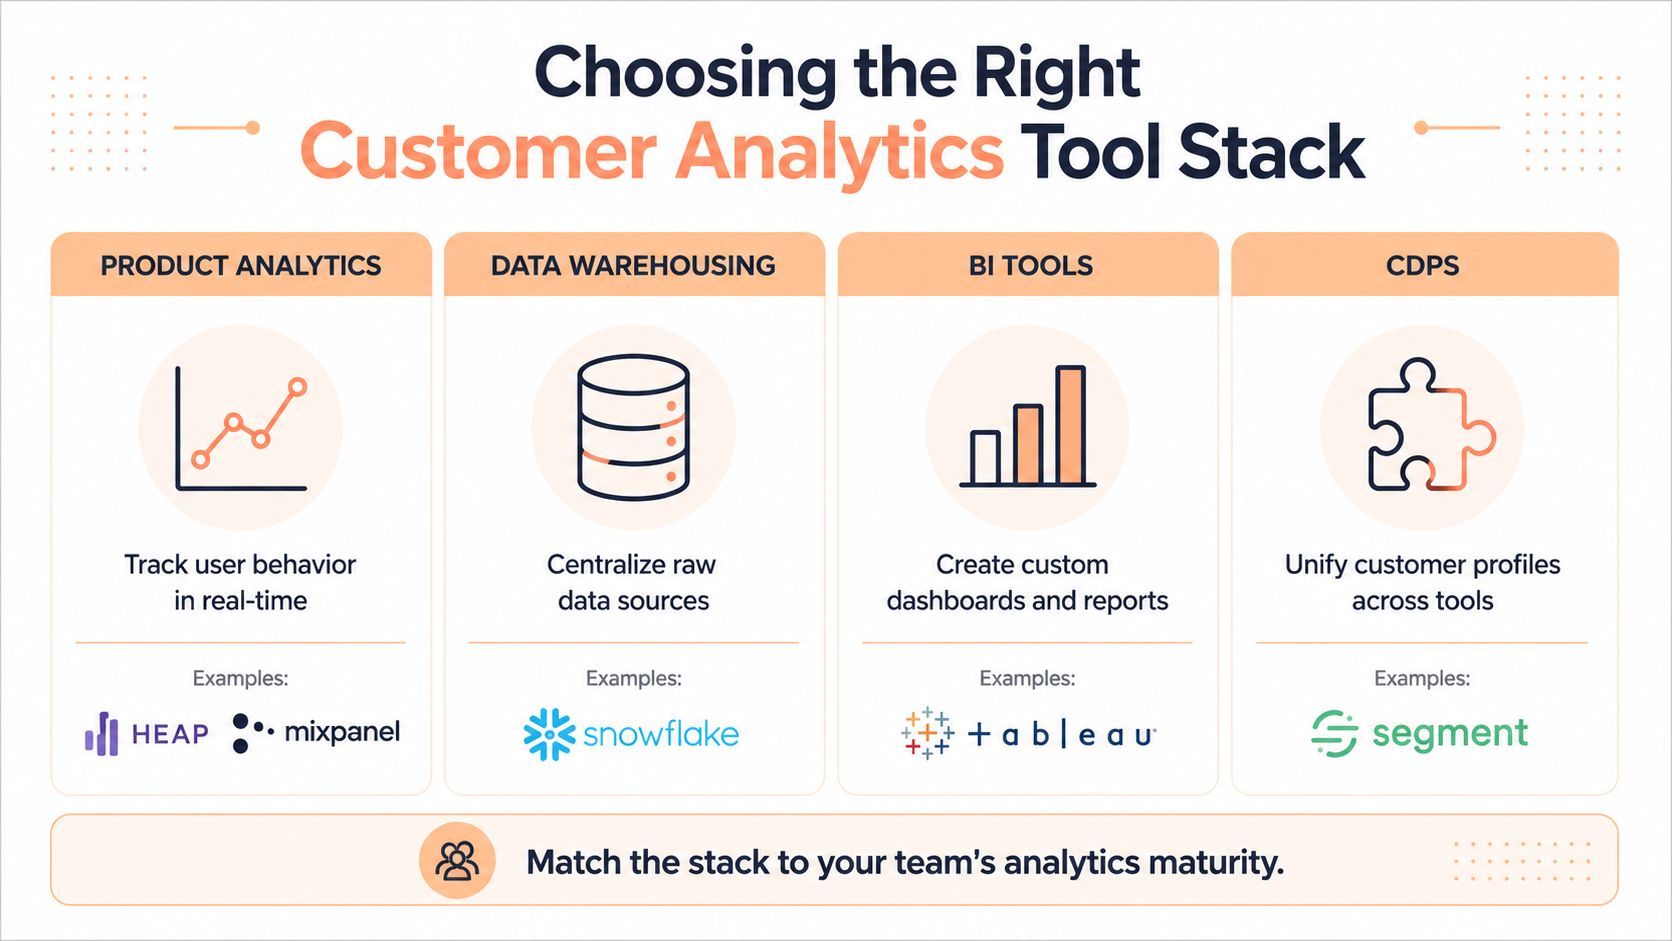
A SaaS team usually needs four layers to answer customer questions without guessing. Product analytics shows what users do in the app. A customer data platform helps resolve identity across systems. BI and revenue tools turn subscriptions and payments into financial views. Support and feedback tools explain where the experience breaks down and where customers get stuck.
What each layer is good at
Product analytics platforms, such as Mixpanel or Heap, are strong for funnels, retention, and event-based segmentation. They are weaker when the question depends on billing history or customer support context. CDPs are better at stitching identities and routing unified profiles to other tools, and they complement product analysis and revenue reporting rather than replacing them.
BI tools such as Tableau, or a warehouse-native setup, are where you combine product, payment, and CRM data into custom views. If you want to compare churn by billing outcome or revenue by signup source, this is the layer that usually gets it done. For a practical comparison of reporting connections in that kind of stack, compare Power BI connector types before you commit to one reporting path.
A billing platform's default charts are useful, but they are usually narrow. They often show invoices, payments, or subscription status without giving you a full view of behavior, support, and retention. A dedicated analytics layer connects those dots, and that matters most when billing, subscription, and event data need to support the same SaaS decision. If you want a clear view of how those records fit together, Creem's billing overview is a practical reference for subscription and payment workflows in a SaaS stack.
A SaaS founder's buying filter
Don't buy tooling by feature count. Buy it by the decision you need to make. If the team cannot reliably answer why a customer renewed, churned, or expanded, the stack still has a gap.
One option in this category is Creem, which combines billing, subscriptions, and customer data in one place, so payment outcomes and account status live closer to the retention analysis itself. That kind of unification matters because the analytics work is much easier when the billing layer and the customer layer are not split apart.
Instrumenting Events and Building a Trusted Data Layer
A SaaS founder can look at three dashboards and still not know what happened to one customer. The product team may call the account active, billing may show a paid renewal, and support may show a silent account with no tickets. If each system uses different event names, customer IDs, or timestamp rules, the same customer gets split into separate records, and analysts end up debating numbers instead of deciding what to fix.
Start with a naming system an engineer can enforce
Use one event name for one action, and keep it stable. If the product, billing system, and support tool all describe the same renewal differently, clean comparisons break down. The same rule applies to user IDs, account IDs, and timestamps. They need to match across systems so cohort analysis stays aligned.
A practical schema usually includes the event name, user ID, account ID, timestamp, plan, source, device, and a few metadata fields that explain context. Modeled tables for activation, retention, churn, CAC, and LTV should be defined once and reused, so product, growth, and finance are reading the same definitions. That matters because a pricing decision, an onboarding change, or a dunning fix only makes sense if everyone is looking at the same underlying record.
Track one customer action across systems
Take a subscription renewal. In the product layer, it may show up as continued usage. In billing, it shows up as a successful charge. In support, it may never appear unless there was a failed payment or an account question. If you log all three layers consistently, you can separate healthy renewals from involuntary churn and see when a payment issue created a retention problem.
That same logic applies to every SaaS decision that depends on behavior and money being tied together. Onboarding only looks healthy if activation events match actual subscription starts. Expansion only looks real if usage growth and plan changes appear in the same account trail. Dunning only works if payment failures are visible alongside the customer events that happen before a lapse.
If your event flow is getting more complex, the guide to event-driven architecture by CloudCops GmbH can help your engineering team think about how those signals move between systems without breaking the data layer. For churn work specifically, the churn analysis guide is a useful companion because it keeps voluntary churn and payment-related churn in separate buckets.
The goal is not perfect instrumentation on day one. The goal is trustworthy instrumentation on the events that drive onboarding, renewal, cancellation, and expansion.
Turning Analytics Into Retention and Monetization Decisions
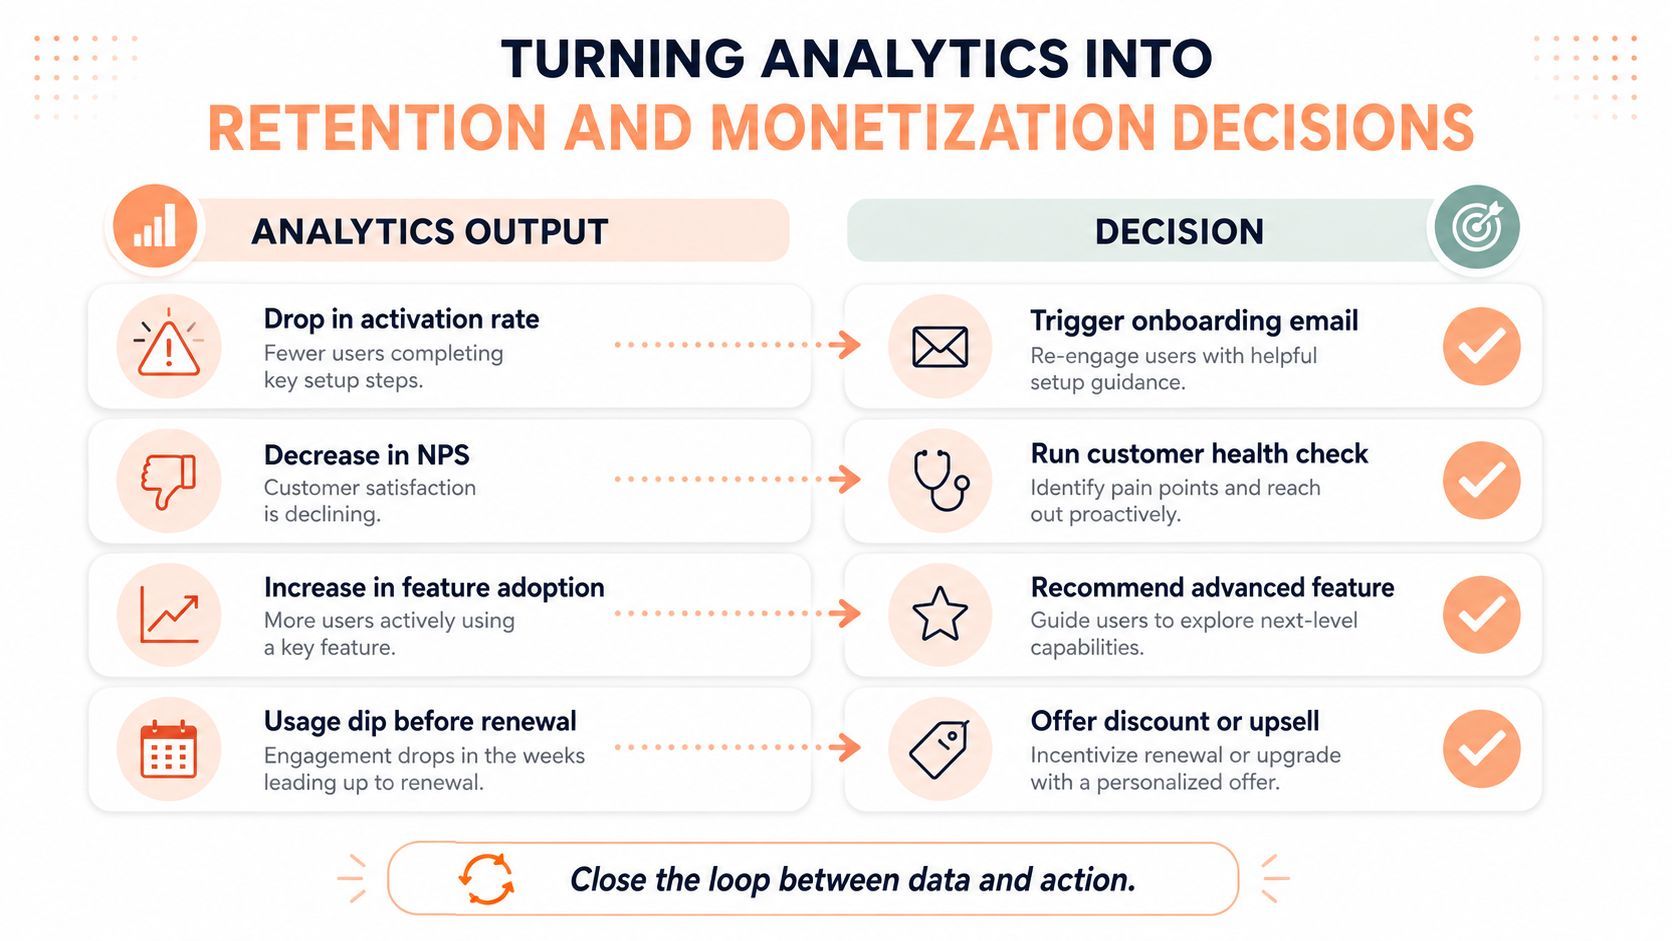
Analytics earns its keep when it changes a decision. A drop in activation rate should send you back to onboarding. A rising refund rate on a new plan should prompt pricing analysis. A spike in payment failures should lead to dunning fixes, not a redesign of the product homepage.
Read retention, churn, and expansion together
A subscription business needs to separate voluntary churn from involuntary churn before it can read retention correctly. Voluntary churn signals a product-fit issue. Involuntary churn points to payment failure, card expiry, or billing friction, which changes the fix entirely.
Behavioral, transactional, and support data need to be read as one picture. A usage dip before renewal, a support ticket about billing, and a failed payment attempt tell a different story from a healthy customer who outgrew the plan. If you want a focused framework for that kind of analysis, the churn analysis guide is a good companion to this work.
Find the segment you're under-serving
Broader personas often hide the best opportunities. A high-value buyer cluster may split spending across different plans, checkout paths, or payment methods, so a simple demographic slice can miss it. Better segmentation uses payment, subscription, and checkout data to show where demand is concentrated but still under-served.
For teams working from a product-led motion, the product led growth glossary helps align product usage signals with growth decisions like activation, expansion, and conversion. That alignment matters because analytics only helps when the insight leads to a concrete next move.
Decision rule: if the metric moved, name the owner, name the action, and name the cohort before you ship another dashboard.
A Practical Starting Point and What to Skip
A first analytics setup should answer a few revenue questions clearly before it tries to cover everything. Early-stage SaaS teams usually get more value from a small set of trusted metrics than from a broad analytics layer that no one relies on. The market is still moving toward cloud-delivered analytics and reporting, but that does not mean a startup should build a large stack before it knows which decisions matter most.
Start with these four areas, and leave the rest for later.
- Track activation, retention, churn, and payment failure first. These metrics connect directly to onboarding, renewal, and revenue recovery, so they help a founder see which part of the customer journey needs attention.
- Review one cohort and one segment every week. Compare outcomes by acquisition source or plan type, beyond company-wide averages, so you can spot where a specific path is working or failing.
- Keep support, billing, and product events in the same view. A signup, a usage drop, and a failed charge only become useful together, because that combination explains whether the problem is product adoption, billing friction, or both.
- Defer vanity dashboards and extra event spam. More charts do not fix unclear definitions, and more events do not help if tracking is inconsistent or hard to trust.
Privacy and governance still matter. Once behavioral, transactional, and feedback data sit together, the team needs disciplined consent handling, consistent identifiers, and careful access control. That is what keeps customer analytics usable when you are making pricing, onboarding, dunning, or expansion decisions. The strongest programs stay simple enough for the team to trust and specific enough to support action.