
Net revenue retention measures how recurring revenue from customers present at the start of a period changes after expansion, contraction, and churn, while excluding newly acquired customers. An NRR above 100% means that starting customer group generates more recurring revenue than it did initially.
But if existing-customer revenue is growing, does that necessarily mean customers are staying and getting more value? Not always. To answer “what is net revenue retention” usefully, think of it as a revenue bridge, with identifiable gains and losses, rather than a standalone score.
Table of Contents
- Why Net Revenue Retention Matters
- The Core Definition of NRR
- How to Calculate Net Revenue Retention
- Worked NRR Examples
- NRR Benchmarks and Investor Interpretation
- Limitations and Misconceptions
- How to Improve NRR
- A Practical NRR Reporting Checklist
Why Net Revenue Retention Matters
A SaaS team celebrates a busy sales month. New subscriptions are coming in, the customer list is growing, and total recurring revenue looks encouraging.
Then the finance lead separates new customers from existing accounts. Older customers have reduced seats, moved to cheaper plans, or canceled. New sales have concealed a weakening installed base.
That's a hypothetical situation, not a company case study. It illustrates why acquisition growth and existing-customer growth aren't interchangeable. A business can succeed at attracting customers while struggling to preserve the revenue those customers eventually represent.
Separate acquisition from durability
NRR gives teams a way to examine the customer portfolio they already have. Instead of asking how much the whole business grew, they ask whether revenue from established relationships strengthened or weakened.
Different teams can use that distinction to frame different questions:
- Founders: Are new sales adding to a durable base, or replacing revenue we're losing?
- Product leaders: Do customers have reasons to adopt more of the product?
- Customer success teams: Which accounts need help before renewal or a downgrade?
- Finance and revenue teams: Which billing movements explain the change in recurring revenue?
These are diagnostic questions, not conclusions that a percentage can answer by itself.
Practical rule: Use NRR to decide where to investigate, not to declare the business healthy.
The distinction also changes how teams discuss growth plans. If existing-account revenue is weakening, increasing acquisition alone won't address the underlying reasons customers reduce spending. If expansion is strong, managers still need to understand whether it reflects broader adoption, pricing changes, or concentrated growth in a few accounts.
NRR is therefore a lens on recurring-revenue durability. Keep acquisition performance, profitability, and total growth in the conversation, but don't let them substitute for an examination of existing customers.
The Core Definition of NRR
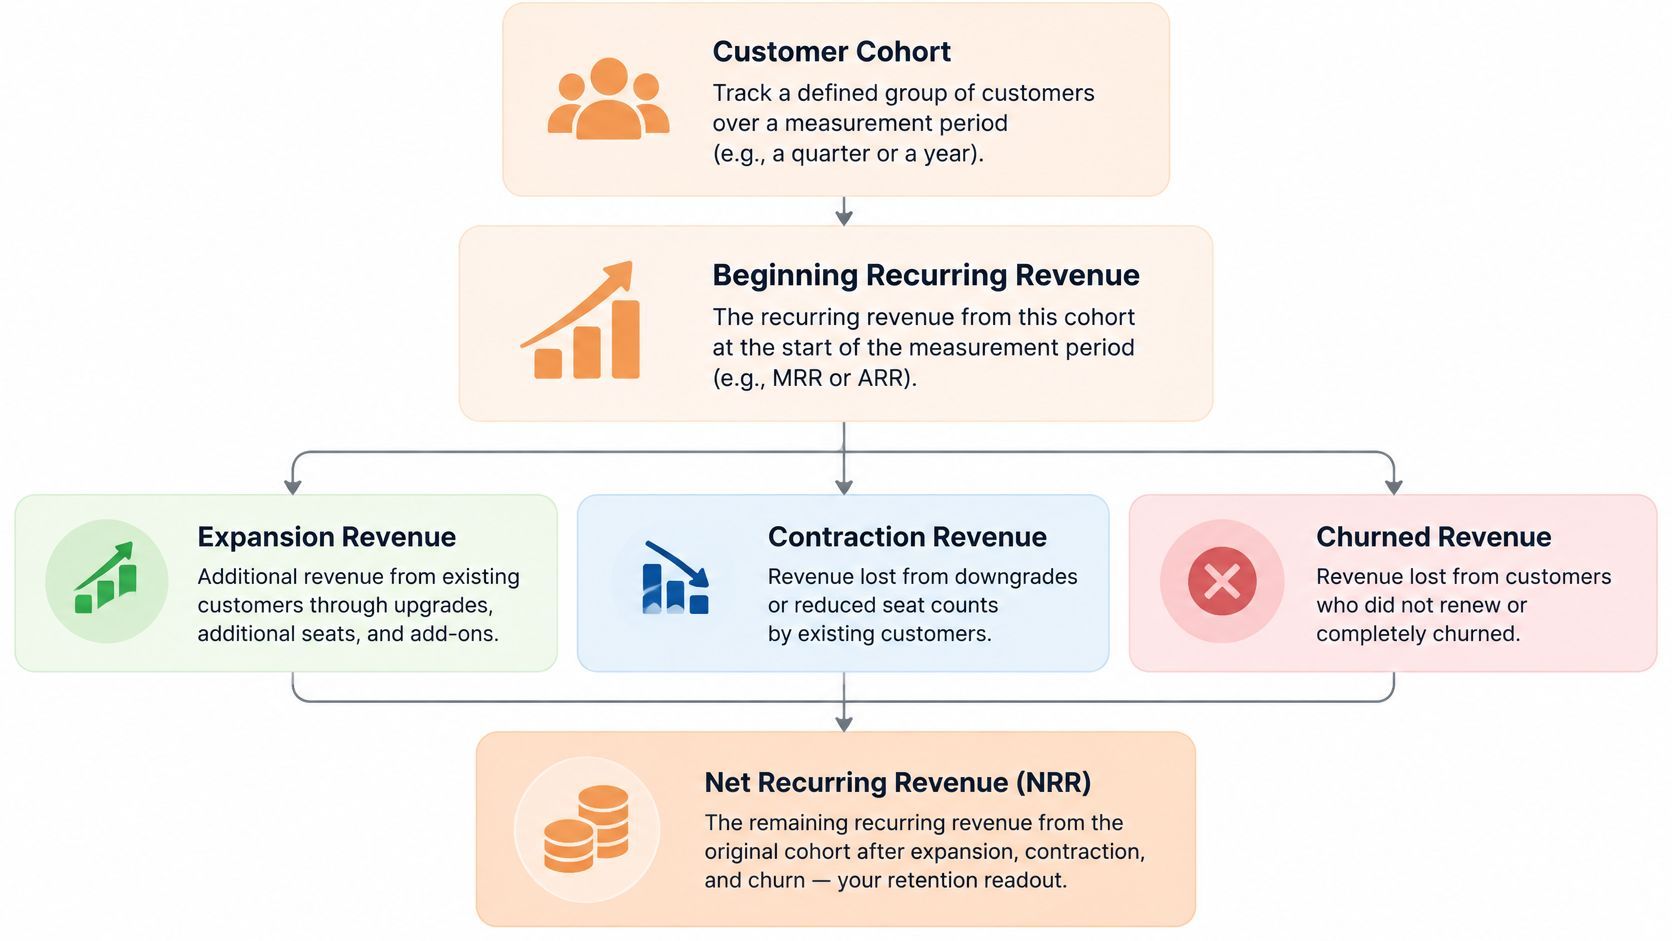
Net revenue retention, also called net dollar retention, follows a fixed starting group of customers over a defined period. Think of that group as a guest list: once the measurement begins, you don't add later arrivals to it.
Identify the customers generating recurring revenue at the beginning. Then follow changes in their spending through the end of the measurement window. Newly acquired customers belong in acquisition reporting, not in this cohort.
The diagram shows how the starting group connects to the revenue movements.
Follow the money within the group
Customers can change their contribution in different ways:
- Expansion: An existing customer adds seats, upgrades, buys an additional recurring product, or increases qualifying usage.
- Contraction: A customer remains active but spends less after a downgrade or reduction in seats.
- Churn: A customer cancels, removing its recurring revenue from the cohort.
The important distinction is between retaining an account and retaining its revenue. A customer who stays on a cheaper plan still counts as a retained customer, but contributes less revenue.
That's why related retention measures answer different questions.
| Measure | Main question | What it can conceal |
|---|---|---|
| Net revenue retention | How did existing-customer revenue change, including expansion? | Losses offset by growing accounts |
| Gross revenue retention | How much starting revenue remained before expansion? | Growth within retained accounts |
| Logo retention | How many starting customers remained? | Changes in each customer's spending |
Read the result as a balance
The interpretation is a comparison with the cohort's starting revenue. Expansion can exceed losses, exactly offset them, or fail to cover them.
Don't interpret that balance as a statement about every customer. Some customers may expand while others leave. The headline describes the combined revenue outcome, while the bridge reveals the different experiences underneath it.
How to Calculate Net Revenue Retention
Start by choosing the measurement window and revenue basis. You can compare monthly recurring revenue at the beginning and end of an annual window, for example, without mixing monthly amounts with annualized amounts.
Monthly recurring revenue (MRR) and annual recurring revenue (ARR) are different revenue scales. Whichever you use, keep every component on the same basis.
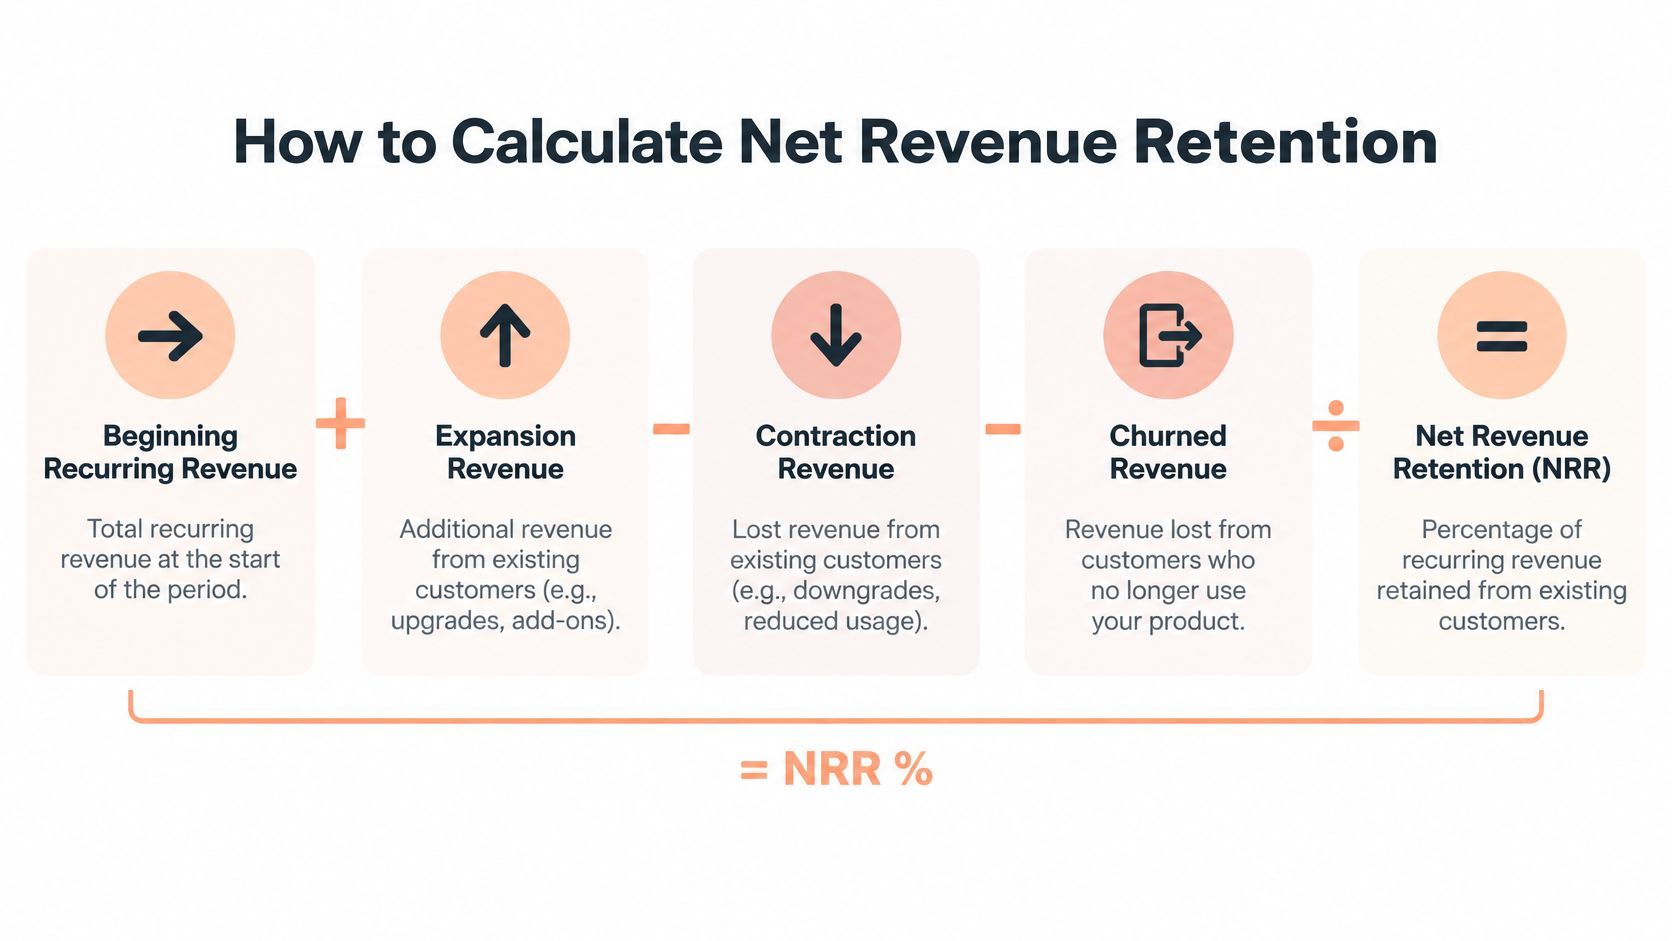
The calculation follows this sequence.
Build the numerator before dividing
NRR = ((Beginning recurring revenue + Expansion revenue − Contraction revenue − Churned revenue) ÷ Beginning recurring revenue) × 100, following the standard fixed-cohort calculation documented by ChartMogul.
The numerator represents ending recurring revenue attributable to the original group. The denominator stays fixed because you're measuring change relative to what that group represented initially, not relative to the company's current total.
NRR Formula Components
| Component | Included in numerator | Example |
|---|---|---|
| Beginning recurring revenue | Yes, starting balance | Recurring subscriptions active at the opening date |
| Expansion revenue | Yes, added | Additional seats or a higher subscription tier |
| Contraction revenue | Yes, subtracted | Fewer seats or a lower subscription tier |
| Churned revenue | Yes, subtracted | Canceled recurring subscription |
| New-customer revenue | No | A subscription first purchased during the window |
Don't substitute total receipts for recurring revenue without deciding what belongs in the metric. A payment can contain adjustments that aren't durable changes to a subscription.
Set classification rules first
Before running the calculation, document how your team treats plan changes, discounts, refunds, proration, and affiliate commissions. Specify whether you're measuring billed, collected, or recognized revenue, since switching between them makes comparisons unreliable.
A recurring discount and a temporary invoice credit need separate consideration. Likewise, a partial-period upgrade charge shouldn't automatically become the customer's new recurring run rate.
The embedded video offers another way to work through the calculation.
Keep the calculation policy alongside the report. The equation is straightforward; consistent classification is what makes the result comparable.
Worked NRR Examples
The clearest way to understand the bridge is to keep the starting customer group unchanged and trace each movement. The following calculations are illustrative, not reported company performance.
When expansion offsets losses
Consider the annual example below, using the amounts in Stripe's explanation of net revenue retention: beginning recurring revenue is $1,000,000, expansion adds $150,000, downgrades remove $50,000, and churn removes $100,000, leaving $1,000,000 and producing 100% NRR.
| Bridge movement | Calculation treatment |
|---|---|
| Starting subscriptions | Establish the opening revenue balance |
| Upgrades and additional seats | Add expansion |
| Downgrades | Subtract contraction |
| Cancellations | Subtract churn |
| Ending cohort revenue | Compare with the starting balance |
The cohort hasn't grown in revenue terms, but that doesn't mean nothing happened. Customers reduced spending and canceled, while other customers increased their commitments enough to replace the losses.
That distinction matters operationally. A flat outcome with substantial movement calls for different investigation than a customer base with little change.
When expansion exceeds losses
A separate worked example uses $100,000 MRR, adds $12,000 from expansion, subtracts $4,000 from contraction, and subtracts $6,000 from churn; dividing the resulting cohort revenue by starting MRR produces 102% NRR, as illustrated in the net revenue retention calculation discussion.
Here, existing customers collectively contribute more recurring revenue at the end. New subscriptions acquired during the window aren't needed to produce that result.
Notice what the result doesn't establish: whether upgrades came from many customers or a concentrated group, whether customers added meaningful usage, or whether pricing changes drove the increase. Those require supporting detail.
When losses exceed expansion
For a shrinking cohort, the mechanics are unchanged. If downgrades and cancellations remove more recurring revenue than upgrades and additions contribute, ending cohort revenue falls below the opening balance.
A retention result can look stable while the customer experience underneath it is anything but stable.
Avoid changing the measurement policy to make these scenarios look better. Counting a temporary billing adjustment as ongoing expansion changes the reported bridge without demonstrating a stronger customer relationship.
NRR Benchmarks and Investor Interpretation
Benchmarks help establish context, but only when you know whose customers, revenue model, and measurement period they describe. A public-company historical series isn't directly interchangeable with a private-company survey.
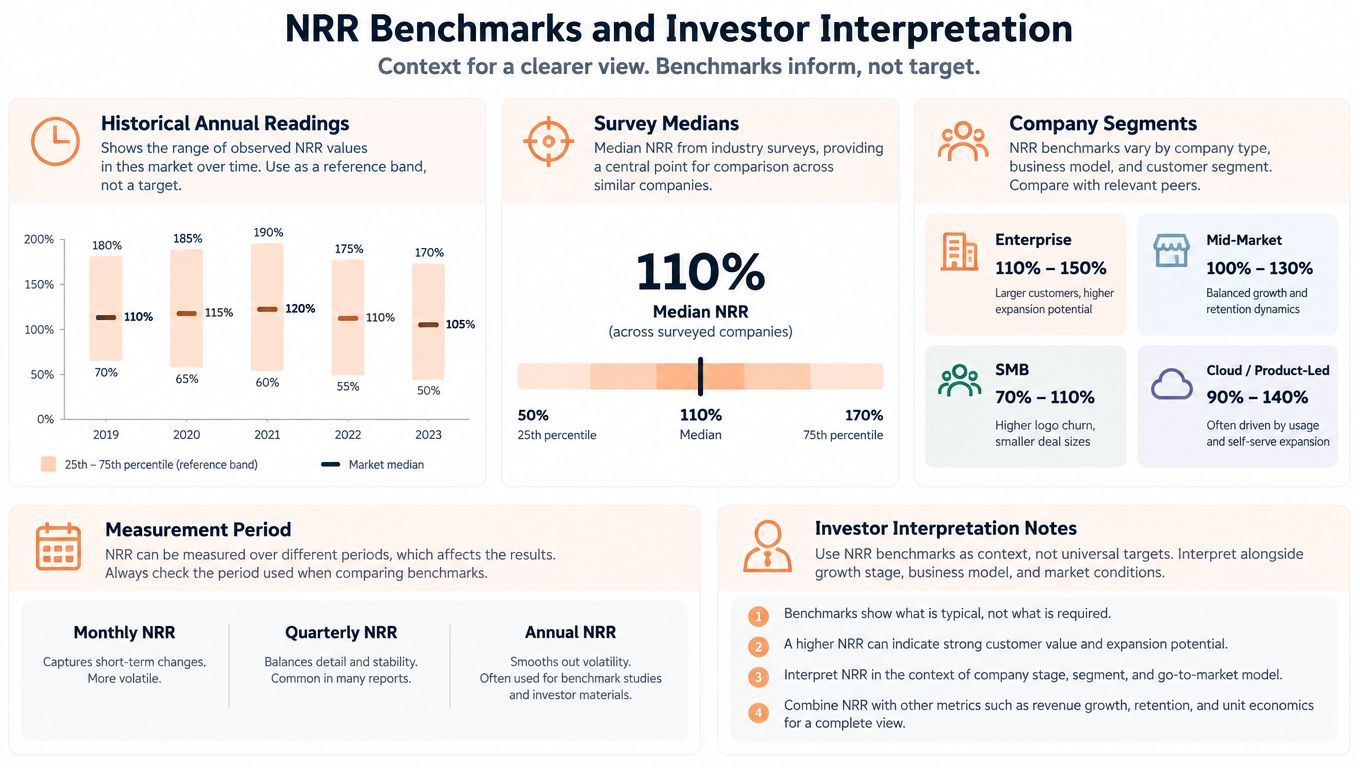
The benchmark visual highlights those comparison dimensions.
Use reference points, not universal targets
The Cloud Ratings compilation of software-company retention data reports annual NRR around 101% to 109% across much of 2010–2023, including 109% in 2021, 105% in 2022, and 103% in 2023; it also provides context for SaaS Capital's 2025 private B2B SaaS survey of more than 1,000 companies, which measured retention from December 2023 to December 2024 and reported the medians below.
What NRR Reveals About Existing Customers
| Metric | What it measures | 2025 reported median |
|---|---|---|
| Net revenue retention | Cohort revenue after expansion and losses | 101% |
| Gross revenue retention | Cohort revenue retained without expansion | 91% |
Read the measures together. The difference illustrates how expansion can support an existing-customer revenue base even while the business loses some starting revenue through cancellations and downgrades.
Don't treat that relationship as proof that losses are harmless. Ask which customers expanded and whether those gains are repeatable.
Match the comparison to the business
For investor-oriented reporting, a useful approach is to pair retention with acquisition efficiency, gross margin, cohort size, and overall growth. Those additional views help distinguish an attractive revenue pattern from an expensive or concentrated one.
Keep the underlying revenue definition consistent, too. A practical guide to calculating ARR for subscription businesses can help teams align the recurring-revenue foundation before comparing retention.
A sensible benchmark discussion asks:
- Comparable customers: Do the businesses sell to similar buyer sizes?
- Comparable timing: Are the observation windows and customer maturity aligned?
- Comparable expansion: Can customers add seats, usage, products, or meaningful plan capacity?
The most useful takeaway isn't a target copied from another company. It's a sharper set of questions about your own customer economics.
Limitations and Misconceptions
Does high NRR mean the business is healthy? Not necessarily. A revenue-weighted metric can look strong when expanding large accounts outweigh the departure of smaller customers.
It also excludes new-customer performance, acquisition costs, gross margin, and the number of customers retained. Treating it as a complete health score asks the metric to answer questions it wasn't designed to answer.
Customer mix changes expectations
The SaaS Capital B2B SaaS retention benchmarks reported 2025 median NRR of 98% for companies with annual contract value below $12,000, compared with 106% for those above $250,000.
That comparison challenges a universal threshold. A lower-value subscription may offer fewer natural expansion paths than an enterprise contract, even when customers continue using the product.
The practical response is to examine the customer mix rather than assume every product should produce the same revenue pattern.
| Apparent strength | Question to ask |
|---|---|
| Large-account expansion | How concentrated are the gains? |
| Higher spending per account | Did adoption grow, or did prices change? |
| Strong blended retention | Are particular plans or regions weakening? |
| Recovered renewal revenue | Was baseline revenue restored rather than expanded? |
Recovery isn't automatically expansion
Payment recovery deserves particular care. Collecting an overdue renewal generally restores revenue that was already expected; it shouldn't automatically be described as a customer increasing their commitment.
Likewise, a seat purchase and a price increase may both qualify as expansion under a documented policy, but they tell different stories. Separate them so product and revenue teams can interpret the result.
Interpretation check: Ask whether the same headline would still look reassuring if the largest expanding account disappeared from the explanation.
That isn't a request to remove legitimate revenue from the calculation. It's a way to expose dependence on individual accounts and avoid mistaking concentration for broad customer success.
How to Improve NRR
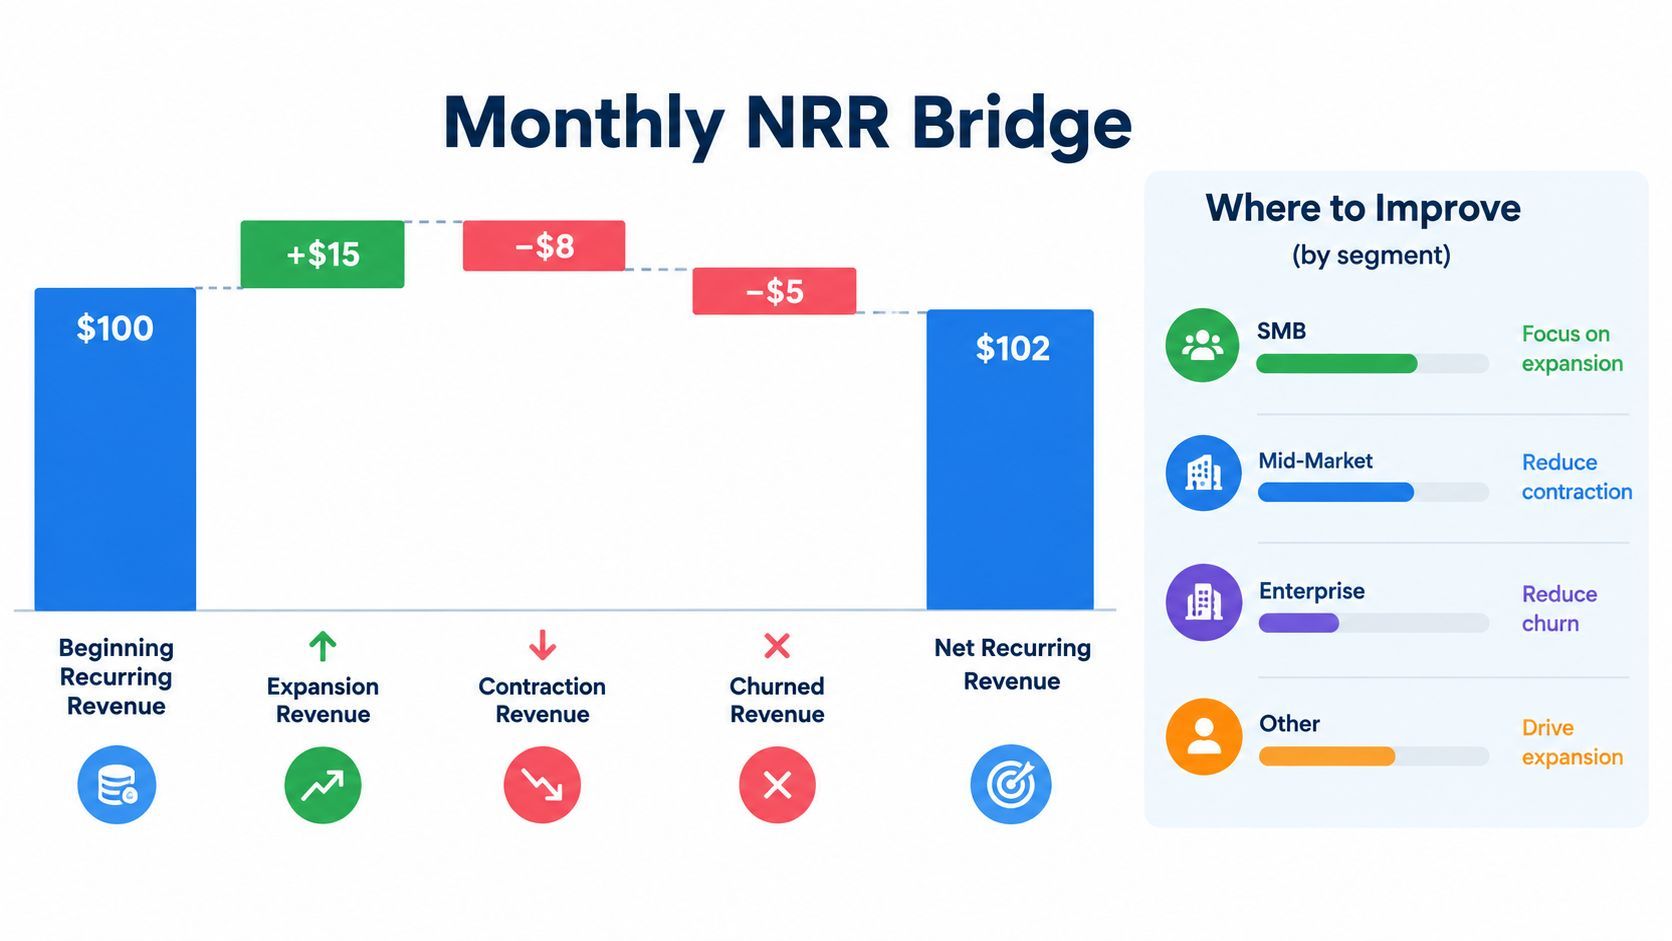
Start with the movements, not a target percentage. Build a monthly bridge that connects opening recurring revenue to expansion, contraction, churn, and the closing balance.
Then attach each movement to a customer and a reason. A report becomes actionable when someone can move from a summary category to the subscription event that created it.
Diagnose before choosing an intervention
Segment the bridge by acquisition channel, product plan, geography, customer maturity, and payment-failure status. Use the segments to identify where further investigation is worthwhile, rather than assuming every difference has the same cause.
A useful operating view connects each movement with a different response:
| Bridge component | Investigation | Potential action |
|---|---|---|
| Seat expansion | Are customers bringing colleagues into active workflows? | Improve invitations and team onboarding |
| Plan upgrades | Do customers understand the additional value? | Clarify capabilities and upgrade paths |
| Contraction | Which needs changed before the downgrade? | Review packaging and adoption barriers |
| Cancellations | Why did customers stop? | Address recurring product or service problems |
| Failed renewals | Was the loss commercial or payment-related? | Review dunning and recovery handling |
Don't start with a broad upsell campaign if the main issue is an unreliable renewal process. Don't redesign checkout when customers are leaving because the product no longer fits their work.
For cancellation diagnosis, use a structured churn analysis process to connect subscription events with customer explanations. Keep voluntary cancellations separate from payment-related losses so the responsible teams can choose appropriate actions.
Connect product work with billing work
Product teams can investigate adoption barriers and whether higher tiers offer useful additional capacity. Customer success and support teams can review downgrade requests, unresolved issues, and renewal conversations.
Billing teams should examine how subscription changes are recorded. For a merchant-of-record setup, relevant workflows include seat-based subscription management, proration, customer self-service, smart dunning, and payment recovery. These mechanisms can support retention work, but none guarantees a particular result.
Maintain a shared review rhythm. Finance reconciles movements, product and customer-facing teams explain customer behavior, and billing owners check whether technical events were classified correctly.
Record a hypothesis beside each intervention, such as improving team activation or reducing avoidable renewal failures. At the next review, compare the relevant bridge component and supporting customer evidence, not just the overall percentage.
Improvement means changing the underlying customer or payment outcome, not relabeling the same revenue.
A Practical NRR Reporting Checklist
A trustworthy retention report needs a calculation policy and an explanation of what changed. Someone outside the team should be able to understand the cohort, reproduce the method, and identify the major movements without guessing.
For variable billing, the technical guide to calculating NRR without misleading yourself discusses smoothing usage with multi-month averages, documenting payment-failure treatment, and maintaining customer-level event detail.
Validate the calculation
- Measurement window: State the opening and closing dates and the recurring-revenue basis.
- Cohort membership: Save the starting customer list and verify that later acquisitions haven't entered it.
- Revenue policy: Document billed, collected, or recognized revenue, plus the treatment of credits, refunds, discounts, commissions, and proration.
- Payment handling: Specify grace periods and how recovery affects previously recorded losses.
- Currency treatment: Normalize exchange rates consistently so currency movements aren't mistaken for customer behavior.
- Variable usage: Explain any smoothing and separate volatile consumption from committed subscriptions.
These checks make the report auditable. They also help teams distinguish a genuine commercial change from an adjustment caused by reporting choices.
Communicate the meaning
Present cohort size, annual contract value, gross retention, logo retention, and total revenue growth alongside the bridge. Break expansion into meaningful sources, and flag concentration in individual accounts.
Use a practical foundation for SaaS billing to align the subscription records behind the report. When the billing policy changes, annotate the change rather than presenting the next result as directly comparable without qualification.
Your commentary should explain the largest movements, the customer evidence behind them, and the actions assigned to owners. If an explanation remains uncertain, say so and identify what needs checking.
NRR is most useful as a diagnostic lens. A transparent bridge lets teams discuss which revenue they preserved, which revenue customers added, and which losses require attention.
Creem offers merchant-of-record payments, subscription billing, seat-based plan management, proration, and smart dunning for software businesses. Visit Creem to explore how those workflows can support your subscription operations and help you investigate the billing events behind your retention bridge.